Warning: fopen(/home/virtual/enm-kes/journal/upload/ip_log/ip_log_2024-04.txt): failed to open stream: Permission denied in /home/virtual/lib/view_data.php on line 88
Warning: fwrite() expects parameter 1 to be resource, boolean given in /home/virtual/lib/view_data.php on line 89
Characteristics of Immune-Related Thyroid Adverse Events in Patients Treated with PD-1/PD-L1 Inhibitors
Department of Internal Medicine, Chonnam National University Medical School, Gwangju, Korea
Corresponding author: A Ram Hong. Department of Internal Medicine, Chonnam National University Medical School, 160 Baekseo-ro, Dong-gu, Gwangju 61469, Korea, Tel: +82-31-379-7635, Fax: +82-31-379-7628, E-mail: wanilove23@nate.com
• Received: November 6, 2020 • Revised: January 28, 2021 • Accepted: February 17, 2021
This is an Open Access article distributed under the terms of the Creative Commons Attribution Non-Commercial License (https://creativecommons.org/licenses/by-nc/4.0/) which permits unrestricted non-commercial use, distribution, and reproduction in any medium, provided the original work is properly cited.
Thyroid immune-related adverse events (IRAEs) have been reported in patients treated with programmed cell death protein-1 (PD-1) and programmed cell death protein-ligand 1 (PD-L1) inhibitors. We investigated the incidence and clinical course of PD-1/PD-L1 inhibitor-induced thyroid IRAEs, and identified predictable clinical risk factors of thyroid IRAEs, in particular, overt hypothyroidism (OH).
Methods
We retrospectively reviewed the medical records of 325 cancer patients receiving PD-1/PD-L1 inhibitor in a tertiary referral center.
Results
A total of 50.5% (164/325) of patients experienced at least one abnormal thyroid function following PD-1/PD-L1 inhibitor. Eighty-four patients (51.2%) of them recovered to normal thyroid function during follow-up. In overall population, 25 patients (7.7%) required thyroid hormone replacement therapy due to PD-1/PD-L1 inhibitor-induced OH. Patients who progressed to OH showed significantly higher baseline thyroid stimulating hormone level and longer duration of PD-1/PD-L1 inhibitor therapy than those without thyroid dysfunction or OH (both P<0.001). Median time interval to the development of OH was 3 months after the therapy. OH was significantly associated with positive anti-thyroid peroxidase antibody at baseline and anti-thyroglobulin antibody during the therapy than those without thyroid dysfunction or OH (P=0.015 and P=0.005, respectively). We observed no patients with OH who were able to stop levothyroxine replacement after the cessation of PD-1/PD-L1 inhibitor therapy.
Conclusion
PD-1/PD-L1 inhibitor-induced thyroid dysfunctions are considerably reversible; however, OH is irreversible requiring levothyroxine replacement even after stopping the therapy. Positive thyroid autoantibodies may predict the progression to OH.
Immune checkpoint inhibitors (ICIs) are the current mainstays of anti-cancer treatment by blocking immune checkpoints that mediate inhibitory signals to decrease T-cell activity, thereby restoring the ability of T-cells to fight cancer cells [1,2]. ICIs are divided into three classes: cytotoxic T-lymphocyte-associated protein-4 (CTLA-4) inhibitors, programmed cell death protein-1 (PD-1) inhibitors, and programmed cell death protein-ligand 1 (PD-L1) inhibitors [3,4]. CTLA-4 inhibitors (ipilimumab) were the first to be approved for cancer treatment followed by PD-1 inhibitors (nivolumab and pembrolizumab), and PD-L1 inhibitors (atezolizumab, avelumab, and durvalumab).
Despite their anti-cancer efficacy, the stimulated immune response by ICIs induces broad spectrum immune-related adverse events (IRAEs) in the affected organs, including the skin, gastrointestinal tract, liver, lung, brain, and endocrine organs [4,5]. The IRAEs are different from those induced by traditional chemotherapeutic agents, and the underlying mechanisms of IRAEs are still unclear [6–8].
Thyroid IRAEs are the most frequently reported endocrine dysfunctions in clinical trials and real-world data [9,10]. While the overall survival of cancer patients is prolonged by ICI therapy, the incidence and prevalence of thyroid IRAEs are remarkably increasing. The overall incidence of ICI therapy-induced hypothyroidism is reported to be 6.6% (95% confidence interval, 5.5% to 7.8%) [9]. Thyroid IRAEs are more frequently associated with PD-1/PD-L1 inhibitors than CTLA-4 inhibitors suggesting greater impact of PD-1/PD-L1 inhibitors on the thyroid gland than that of CTLA-4 inhibitor [11]. Therefore, careful evaluation and appropriate management of PD-1/PD-L1 inhibitor-related thyroid dysfunction is crucial in clinical practice.
In line with the above information, we aimed to figure out the actual incidence and clinical course of thyroid IRAEs in patients treated with PD-1/PD-L1 inhibitors in a real-world setting. Furthermore, we examined the appropriate strategy for thyroid hormone replacement during and after the cessation of PD-1/PD-L1 inhibitor therapy in patients who experienced the therapy-induced overt hypothyroidism (OH).
METHODS
Patient population
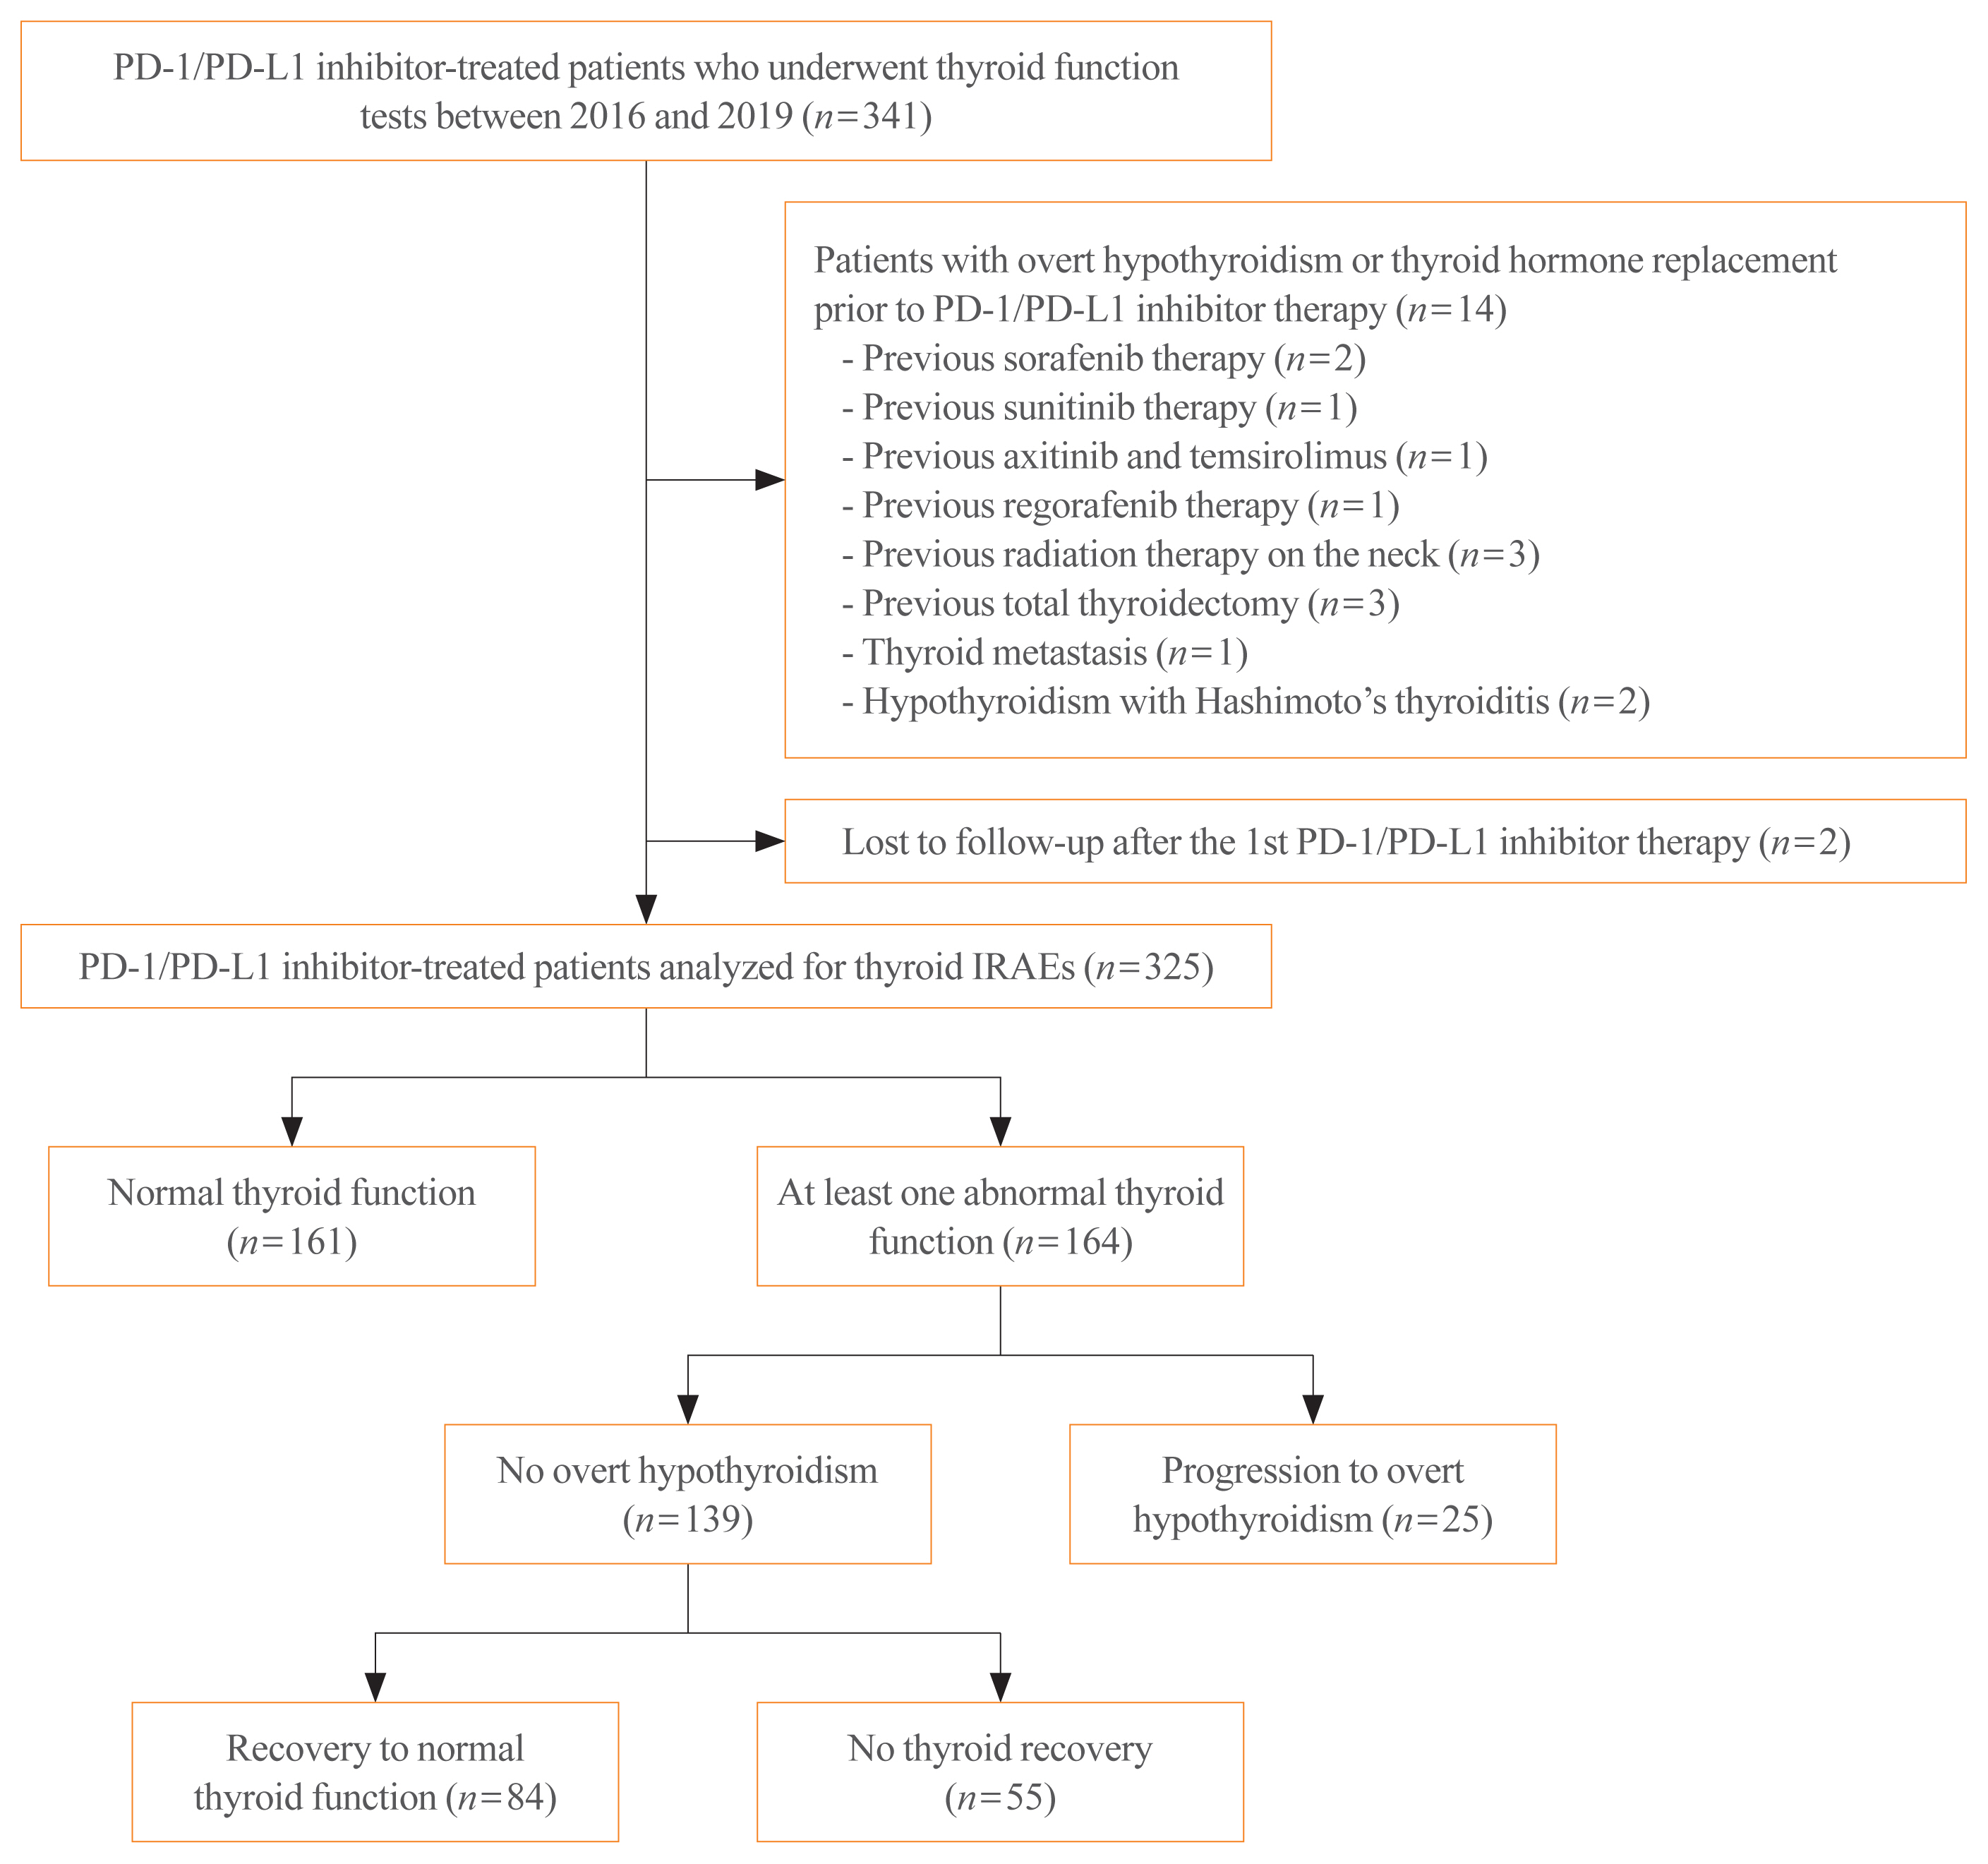
The initially retrieved 515 patients who were treated with PD-1/PD-L1 inhibitors between January 2016 and August 2019 at Chonnam National University Hwasun Hospital. Subsequently, 174 patients who did not undergo thyroid function tests prior to PD-1/PD-L1 inhibitor therapy were excluded. Among the eligible 341 patients, the patients who showed OH at baseline thyroid function tests or took levothyroxine before PD-1/PD-L1 inhibitor therapy were excluded (n=14). In detail, three patients had undergone total thyroidectomy owing to thyroid cancer and one patient had thyroid metastasis. Five patients had previous treatment-induced hypothyroidism (i.e., sorafenib, sunitinib, axitinib, temsirolimus, and regorafenib), three patients had prior history of radiotherapy on the neck, and two patients had hypothyroidism arising from Hashimoto’s thyroiditis. We further excluded patients who were not followed-up after the 1st PD-1/PD-L1 inhibitors (n=2). Consequently, a total of 325 patients receiving PD-1/PD-L1 inhibitors with no overt thyroid dysfunction at baseline were included in the analysis (Fig. 1). The patients were divided into three groups according to thyroid function status: the normal thyroid function group (i.e., those who showed normal range of thyroid functions during the PD-1/PD-L1 inhibitor therapy), the no-OH group (i.e., those who had at least one episode of thyroid dysfunction, however, did not progress to OH), and the OH group. The no-OH group was subdivided into two groups according to the recovery to normal thyroid function. Based on this, 161 patients were included in the normal thyroid function group, while the no-OH group and the OH group had 139 and 25 patients, respectively.
This study was approved by the Institutional Review Board of Chonnam National University Hwasun Hospital (No. CNUHH-2020-065), and was conducted in accordance with the guidelines in the Declaration of Helsinki. The need for informed consent was waived due to the retrospective nature of the study.
Evaluation of thyroid hormone function and thyroid autoantibodies
Thyroid function tests, including thyroid stimulating hormone (TSH) and free thyroxine (fT4), were performed at the time of initiating PD-1/PD-L1 inhibitor therapy and during the follow-up period in all patients. A median of four thyroid function tests was performed on each patient during follow-up. The time interval between the thyroid function tests was different depending on each patient. In general, thyroid functions were measured every one to three cycles of PD-1/PD-L1 inhibitor therapy until 6 months after starting the therapy.
Serum TSH and fT4 levels were measured by electrochemiluminescence method (Cobas e601 automatic immunoassay, Roche Diagnostics, Basel, Switzerland). The laboratory reference ranges are 0.4 to 4.8 mIU/L for TSH and 0.8 to 1.71 ng/dL for fT4.
Subclinical hypothyroidism was defined as elevated TSH level of 4.8 to 10 mIU/mL with normal fT4 level, and subclinical hyperthyroidism was defined as reduced TSH level of <0.4 mIU/mL with normal fT4 level. Isolated hypothyroxinemia and hyperthyroxinemia were defined as normal TSH level with low fT4 (<0.8 ng/dL) and high fT4 (>1.71 ng/dL) level, respectively. Overt hyperthyroidism was defined as decreased TSH level of <0.4 mIU/mL with increased fT4 level of >1.71 ng/dL, while OH was defined as increased TSH level >4.8 mIU/mL with decreased fT4 level of <0.8 ng/dL and/or TSH ≥10 mIU/L regardless of fT4 levels requiring levothyroxine replacement.
We collected the data on thyroid antibodies against thyroid peroxidase (anti-TPO) and thyroglobulin (anti-Tg) that were measured using electrochemiluminescence (Cobas e601 automatic immunoassay). A TPO antibody titer >34 IU/mL and a Tg antibody titer >115 IU/mL were defined as elevated autoantibody levels, respectively.
Evaluation of thyroid ultrasonographic features
Thyroid ultrasonography was performed to evaluate radiologic changes in the thyroid gland, including echogenicity, blood flow, and size during the PD-1/PD-L1 inhibitor therapy. The volume (mL) of each thyroid lobe was calculated as 0.479×depth×width×length (cm), and thyroid volume was the sum of the volumes of both lobes [12].
Statistical analysis
Data are expressed as mean±standard deviation or median (interquartile range) or number (%). Continuous variables were analyzed using Student’s t test. Categorical variables were analyzed using the chi-square test. Comparisons between three groups were performed using analysis of variance (ANOVA), and Bonferroni correction was adopted as a post hoc analysis to account for multiple testing issues. All statistical analyses were performed using SPSS Statistics version 25 (IBM, Armonk, NY, USA), and P value <0.05 was considered to be statistically significant.
RESULTS
Patient characteristics
Table 1 shows the baseline characteristics of PD-1/PD-L1 inhibitor-treated patients analyzed for thyroid IRAEs. The mean age of all patients at the time of initiating PD-1/PD-L1 inhibitor treatment was 67.2 years and 71.1% of them were males. The PD-1/PD-L1 inhibitor therapy was introduced to treat various type of cancer, and lung cancer accounts for 56.6% of all cancers. Among the patients, 80.6% (262/325) were treated with PD-1 blockade: pembrolizumab in 145 patients and nivolumab in 117 patients. Approximately 19.4% (63/325) received PD-L1 blockade therapy: durvalumab in 45 patients and atezolizumab in 18 patients. The median duration of follow-up was 5.0 months (interquartile range, 1.0 to 9.0). The median duration of PD-1/PD-L1 inhibitor therapy was 4.0 months (interquartile range, 1.0 to 9.0) with 6 doses (interquartile range, 3.0 to 12.0). At the last follow-up, only 21 patients (6.5%) continued PD-1/PD-L1 inhibitor therapy. The most common cause of discontinuation of PD-1/PD-L1 inhibitors was disease progression (76.9%), followed by treatment-induced adverse events including interstitial lung disease and bleeding (8.3%), financial difficulty (4.0%), non-disease-related death such as hypoglycemic shock and brain hemorrhage (2.5%), and lost to follow-up (1.8%). A total of 95.1% (309/325) of patients showed normal thyroid function at the baseline thyroid function tests prior to PD-1/PD-L1 inhibitor therapy.
Characteristics of PD-1/PD-L1 inhibitor-related thyroid dysfunctions
During the study period, at least one abnormalities in thyroid function tests were observed in 50.5% (164/325) of patients. Among them, 25 patients required thyroid hormone replacement due to progression to OH. We compared the clinical characteristics of patients according to the development of thyroid dysfunctions (Table 2). OH was more frequently observed in female patients than those in the normal thyroid function group or no-OH group (P=0.025). The occurrence of OH was not associated with the type of PD-1/PD-L1 inhibitor (P=0.592). The median duration of the PD-1/PD-L1 inhibitor therapy and number of PD-1/PD-L1 inhibitor doses were greater in the OH group than in the other two groups (P<0.001). OH group showed significantly elevated baseline TSH level compared to the other two groups (P<0.001); however, the median TSH levels of 2.74 mIU/L was within the normal range. Baseline fT4 level did not differ between the three groups (P=0.217). Thyroid antibodies were measured in 30.5% (99/325) of the patient population before initiating PD-1/PD-L1 inhibitor therapy, and anti-TPO antibodies were more prevalent in the OH group (33.3% vs. 4.4% vs. 4.2%, P=0.015). There were no differences in the prevalence of baseline anti-Tg antibodies between the three groups (P=0.132). During the follow-up period, thyroid antibodies were measured in 20.3% (66/325) of the patient population, and anti-Tg antibodies were more frequently observed in the OH group during the PD-1/PD-L1 inhibitor therapy than in the other two groups (50.0% vs. 11.1% vs. 12.8%, P=0.005). Anti-TPO antibody positivity was not different between the three groups during the follow-up period (P=0.208).
In the no-OH group (n=139), 84 patients (51.2%) naturally recovered to normal thyroid function during follow-up with continued PD-1/PD-L1 inhibitor treatment. Thyroid function recovery was associated with longer duration and increased doses of PD-1/PD-L1 inhibitor treatment (P<0.001 and P=0.001, respectively). Although seven patients remained in the thyrotoxicosis phase during the study period, all of them were negative for TSH binding inhibitory immunoglobulin (Supplemental Table S1). Steroid therapy was not applied to any patients during the follow-up period. Beta blockers were prescribed to two patients to control symptoms during the thyrotoxicosis phase.
Association between thyroid autoantibody positivity and the development of PD-1/PD-L1 inhibitor-related thyroid dysfunctions
We investigated the pattern of thyroid antibody status of 20 patients in whom thyroid antibodies were repeatedly measured before the initiation and during the PD-1/PD-L1 inhibitor therapy (Table 3). Two patients presenting with a shift from positive to negative anti-TPO antibody showed transient isolated hypothyroxinemia and subclinical hypothyroidism, respectively. We observed three patients who newly developed thyroid antibodies during the therapy. Two patients whose anti-Tg antibodies converted from negative to positive progressed to OH, and anti-Tg antibodies remained positive during repeated measurements in the OH phase. One patient presenting with a negative to positive conversion of anti-TPO antibody showed transient subclinical range of thyrotoxicosis followed by normal thyroid function. Interestingly, anti-TPO antibody levels changed to negative again in this patient when measured at the time of normal thyroid function status.
Characteristics of patients who developed overt hypothyroidism after PD-1/PD-L1 inhibitor therapy
Among the 325 patients, OH was observed in 25 (7.7%) patients (Table 4). When we evaluated the temporal changes in thyroid function during the follow-up period, 11 patients presented with subclinical and overt thyrotoxicosis prior to the development of OH and six patients showed a shift to OH from subclinical hypothyroidism. Eight patients rapidly developed OH without the thyrotoxicosis phase or thyroid dysfunction in the subclinical range. The median time interval between the initiation of PD-1/PD-L1 inhibitor therapy and development of OH was 3.0 months (interquartile range, 2.0 to 4.5) and the median replacement dose of levothyroxine was 100 μg/day. At the last follow-up, nine patients (36.0%) continued with the PD-1/PD-L1 inhibitor therapy with levothyroxine replacement. While, PD-1/PD-L1 inhibitor therapy was stopped in 16 patients (64.0%), in 13 of whom the treatment modalities were changed to those other than PD-1/PD-L1 inhibitor treatments. Levothyroxine replacement was maintained in these 13 patients for median 11.0 months (interquartile range, 4.0 to 25.5), and in two of them the dose of levothyroxine was reduced at median 7 months after stopping PD-1/PD-L1 inhibitor therapy. All 13 patients continued levothyroxine replacement until death (six patients) or referral to hospice care (six patients) or lost to follow-up (one patient).
Association between thyroid ultrasonographic features and PD-1/PD-L1 inhibitor-related thyroid dysfunctions
In the current study, thyroid ultrasonography was performed in 18 patients who progressed to OH during the PD-1/PD-L1 inhibitor therapy. Sonographic findings typically represented inflammatory change with diffuse heterogeneous echogenicity and slightly increased thyroid volume in the thyrotoxicosis phase. Subsequently, there was rapid progression to thyroid gland atrophy at the time of OH (Fig. 2). There was a patient who underwent thyroid ultrasonography after PD-1/PD-L1 inhibitor therapy were stopped. He was a 57-year-old male with small cell lung cancer receiving nivolumab who progressed to OH during the therapy and was then started on levothyroxine replacement. At 2 months after stopping nivolumab due to disease progression, he exhibited marked OH with TSH level of 147 mIU/L because he had not taken levothyroxine since stopping nivolumab (Fig. 3). Thyroid ultrasonography showed the severely atrophied thyroid gland after the cessation of nivolumab, which was consequently linked to OH.
DISCUSSION
The present study demonstrated that one or more thyroid dysfunctions were observed in approximately half of the patients following PD-1/PD-L1 inhibitor therapy. However, 51.2% of thyroid dysfunctions spontaneously returned to normal thyroid status during the follow-up period. OH requiring levothyroxine replacement was observed in 7.7% of the overall population, which was similar to previously reported incidence of ICI-induced hypothyroidism. The development of OH was associated with longer duration of PD-1/PD-L1 inhibitor therapy. In addition, baseline anti-TPO antibody positivity and new development of anti-Tg antibody positivity during the therapy were significantly associated with the progression to OH. PD-1/PD-L1 inhibitor-related OH was an irreversible event after stopping the therapy.
Among the various endocrine organs involved in IRAEs, thyroid gland is the most commonly affected one by PD-1/PD-L1 inhibitors. Thyroid IRAEs present themselves with thyroid dysfunction, including hypothyroidism and hyperthyroidism. The majority of PD-1/PD-L1 inhibitor-induced thyrotoxicosis represent a phase of painless thyroiditis, and only a few cases of PD-1/PD-L1 inhibitor-induced autoimmune hyperthyroidism, such as Graves’ disease, were reported [13,14]. Some patients show recovery to normal thyroid function, while others require thyroid hormone replacement due to the occurrence of OH [15,16].
For a better understanding of thyroid IRAEs, the evaluation of baseline thyroid function status and regular assessment of TSH and fT4 levels are helpful. The baseline thyroid function can be readily affected by patients’ general condition and previous cancer treatments. In the current study, 14 patients excluded from the final analysis had preexisting hypothyroidism or took levothyroxine related to prior radiation therapy and tyrosine kinase inhibitors. Sixteen patients (4.9%) of the overall cohort showed a subclinical range of serum TSH level at the baseline thyroid function test, which spontaneously normalized during follow-up. We observed a broad spectrum of thyroid dysfunctions ranging from isolated hypothyroxinemia to OH during the PD-1/PD-L1 inhibitor therapy. At least one abnormal thyroid function was observed in 50.5% (164/325) of the overall patients; however, only 15.2% of them (25/164) progressed to OH requiring thyroid hormone replacement. In the no-OH group, the thyroid function naturally recovered to the normal state in 60.4% (84/139) of the patient population. These findings indicate that a majority of patients maintain normal thyroid functions or experience a mild degree of thyroid dysfunctions not requiring thyroid hormone replacement during the PD-1/PD-L1 inhibitor therapy. The recovery group had a longer duration and increased doses of PD-1/PD-L1 inhibitor treatment; however, the median duration of the therapy in the no recovery group was only 2 months (Supplemental Table S1). Since there was no difference in the patient characteristics except PD-1/PD-L1 inhibitor treatment itself between the two groups, it may be because the observation period of no recovery group was too short to confirm recovery. In our study, thyroid ultrasonography revealed diffuse inflammatory change of thyroid gland with slight increase in thyroid volume during the thyrotoxicosis phase after therapy, followed by rapid shrinkage of the thyroid gland. Subsequently, thyroid gland atrophy was associated with the development of OH.
In the current study, thyroid IRAEs were predominantly reported in female patients just like other autoimmune thyroid diseases. Median duration of the PD-1/PD-L1 inhibitor therapy was longer in patients with OH than in those without thyroid dysfunctions or OH. The median interval from the initiation of PD-1/PD-L1 inhibitor therapy to the development of OH was 3 months and 36% of the patient population with OH continued PD-1/PD-L1 inhibitor therapy. This could be linked to the better anti-tumor efficacy of PD-1/PD-L1 inhibitor therapy when thyroid IRAEs occur. Several previous studies have shown that PD-1/PD-L1 inhibitor-induced thyroid IRAEs were associated with prolonged overall survival or progression-free survival [17–20]. However, we observed no significant difference in progression-free survival according to the presence or absence of thyroid IRAEs in the overall population (P=0.529, data not shown). Unfortunately, the direct correlation between thyroid IRAEs and overall survival was not analyzed due to the diversity of cancer types in our study.
There have been several attempts to identify potential biomarkers to predict thyroid IRAEs [21,22]. The serum Tg, thyroid antibodies, and cytokine levels, such as those of serum interleukin 1β (IL-1β), IL-2, and granulocyte-macrophage colony stimulating factor were suggested as promising candidates for biomarkers [23]. Regarding thyroid antibodies, there are still controversies over their potential as predictive indicators of thyroid IRAEs. Some studies showed significant association of baseline thyroid antibody positivity and the risk of thyroid dysfunction; however, others showed no associations [24–27]. Additionally, recent studies suggest that the positive conversion of thyroid antibodies during PD-1/PD-L1 inhibitor therapy could be a potential marker of thyroid IRAEs [23]. We observed three patients presenting with a negative to positive conversion of anti-TPO antibodies or anti-Tg antibodies during PD-1/PD-L1 inhibitor therapy. Two patients with newly detected anti-Tg antibodies progressed to OH, and the antibodies were measured during the overt thyrotoxicosis and hypothyroidism state, respectively. One patient with newly detected anti-TPO antibodies did not progress to OH, and the autoantibodies were measured during the subclinical thyrotoxicosis phase. However, follow-up thyroid autoantibodies tend to be tested more frequently in patients with thyroid dysfunction after initiation of PD-1/PD-L1 inhibitor treatment. Therefore, it is difficult to conclude that the positive conversion of antibodies during the therapy predicts the progression to OH.
For the proper management of thyroid IRAEs, the decision of initiating deficient hormone replacement for OH is important. Thyroid hormone replacement is recommended when TSH level is over 10 mIU/L [3,28]. Additional important aspect is to decide whether thyroid hormone replacement is to be maintained after stopping PD-1/PD-L1 inhibitor therapy. Current guidelines recommend to maintain thyroid hormone replacement during PD-1/PD-L1 inhibitor therapy and consider cessation of thyroid hormone replacement by re-measurement of thyroid function status after complete interruption of the therapy [3,29]. In the present study, most patients (11/13, 84.6%) who stopped PD-1/PD-L1 inhibitor therapy required same doses of levothyroxine, while two patients required reduced doses of levothyroxine during the follow-up period. All patients discontinued PD-1/PD-L1 inhibitor therapy due to disease progression and there were no drug interruption or dose reduction of the therapy due to thyroid IRAEs. We observed no patients with OH who were able to quit thyroid hormone replacement after stopping PD-1/PD-L1 inhibitor therapy. Accordingly, PD-1/PD-L1 inhibitor-induced severe degree of thyroid IRAEs are clinically irreversible.
Our study has several limitations to be addressed owing to its retrospective nature. Thyroid function tests and measurements of thyroid antibodies were not performed regularly. Moreover, thyroid antibodies were not measured in all cohort patients before the initiation of PD-1/PD-L1 inhibitor therapy and/or during the treatment. It could result in difficulty to precisely interpret the time sequence and causal relationship between thyroid dysfunction and antibody positivity. In addition, thyroid ultrasonography was performed only in a small number of patients. Therefore, based on our findings, we were unable to draw definitive conclusions regarding the predictive power of thyroid antibodies and ultrasonographic findings for thyroid IRAEs.
Taken together, careful evaluation of thyroid function status before starting the PD-1/PD-L1 inhibitor therapy and during the therapy is crucial for the early detection of thyroid IRAEs. Thyroid autoantibody positivity may be helpful to predict the development of OH requiring thyroid hormone replacement. PD-1/PD-L1 inhibitor-induced OH is irreversible; therefore, meticulous decision for cessation of thyroid hormone placement should be necessary. In this case, the identification of thyroid shrinkage on ultrasonography could support the decision that thyroid hormone replacement is required even after stopping the therapy.
Supplementary Information
Supplemental Table S1.
Clinical Characteristics of Patients in No Overt Hypothyroidism Group According to the Recovery of Thyroid Dysfunction (n=139)
This work was supported by a grant from the Chonnam National University Hwasun Hospital Institute for Biomedical Science (No. HCRI19004).
Article information
CONFLICTS OF INTEREST
No potential conflict of interest relevant to this article was reported.
AUTHOR CONTRIBUTIONS
Conception or design: J.H.Y., A.R.H. Acquisition, analysis, or interpretation of data: J.H.Y., A.R.H. Drafting the work or revising: J.H.Y. Final approval of the manuscript: J.H.Y., A.R.H., H.K.K., H.C.K.
Fig. 1
Flow diagram of investigated cohort of programmed cell death 1 (PD-1)/programmed cell death protein-ligand 1 (PD-L1) inhibitor-treated cancer patients to evaluate the occurrence of thyroid immune-related adverse events (IRAEs).
Fig. 2
Thyroid ultrasonographic findings in a 68-year-old male patient treated with programmed cell death 1 (PD-1) inhibitor pembrolizumab for renal cell carcinoma. He initiated to receive 125 μg/day of levothyroxine at 3 months after pembrolizumab. Thyroid ultrasonographic images (A) before therapy, (B) at 1 month after therapy, (C) at 15 months after therapy, and (D) at 40 months after therapy. TSH, thyroid stimulating hormone; T4, thyroxine; TPO, thyroid peroxidase; Tg, thyroglobulin. aOn levothyroxine replacement.
Fig. 3
Thyroid ultrasonographic features and clinical course of a 57-year-old male patient with lung cancer treated with programmed cell death 1 (PD-1) inhibitor nivolumab. He started to receive levothyroxine replacement at 4 months after nivolumab. Severe thyroid gland atrophy was revealed on thyroid ultrasonography at 2 months after stopping nivolumab. Pre-therapy thyroid ultrasonographic images in (A) transverse and (B) longitudinal view. Thyroid ultrasonographic images at 2 months after the last injection of nivolumab in (C) transverse and (D) longitudinal view. TSH, thyroid stimulating hormone; T4, thyroxine; TPO, thyroid peroxidase; Tg, thyroglobulin. aOn levothyroxine replacement.
Table 1
Baseline Characteristics of PD-1/PD-L1 Inhibitor-Treated Patients Analyzed for Thyroid Immune-Related Adverse Events (n=325)
Characteristic
Value
Age at PD-1/PD-L1 inhibitor initiation, yr
67.2±10.6
Female sex
94 (28.9)
PD-1 inhibitor
Pembrolizumab
145 (44.6)
Nivolumab
117 (36.0)
PD-L1 inhibitor
Durvalumab
45 (13.8)
Atezolizumab
18 (5.5)
Type of cancer
Lung cancer
184 (56.6)
Melanoma
39 (12.0)
Renal cell carcinoma
23 (7.1)
Biliary cancer
19 (5.8)
Hepatocellular carcinoma
16 (1.9)
Bladder cancer
10 (3.1)
Gastric cancer
10 (3.1)
Colorectal cancer
8 (2.5)
Oropharyngeal cancer
6 (1.8)
Esophageal cancer
3 (0.9)
Peritoneal carcinomatosis
2 (0.6)
Thymic cancer
1 (0.3)
Nasopharygneal cancer
1 (0.3)
Pancreas cancer
1 (0.3)
Multiple myeloma
1 (0.3)
Canthal cancer
1 (0.3)
Duration of follow-up, mo
5.0 (1.0–9.0)
Duration of PD-1/PD-L1 inhibitor therapy, mo
4.0 (1.0–9.0)
No. of doses of PD-1/PD-L1 inhibitor
6.0 (3.0–12.0)
Baseline thyroid function status
Normal
309 (95.1)
Subclinical hypothyroidism
13 (4.0)
Subclinical hyperthyroidism
3 (0.9)
Values are expressed as mean±standard deviation, number (%), or median (interquartile range).
PD-1, programmed cell death protein-1; PD-L1, programmed cell death protein-ligand 1.
Table 2
Patient Characteristics According to the Development of Thyroid Immune-Related Adverse Events
bP<0.05 between normal thyroid function and no overt hypothyroidism;
cP<0.05 between normal thyroid function and overt hypothyroidism;
dP<0.05 between no overt hypothyroidism and overt hypothyroidism.
Table 3
Summary of Changes in Thyroid Antibody Status in 20 Patients Available for Autoantibody Measurements before Initiation and during the PD-1/PD-L1 Inhibitor Therapy
Values are expressed as number (%) or median (interquartile range).
PD-1, programmed cell death protein-1; PD-L1, programmed cell death protein-ligand 1.
References
1. Chang LS, Barroso-Sousa R, Tolaney SM, Hodi FS, Kaiser UB, Min L. Endocrine toxicity of cancer immunotherapy targeting immune checkpoints. Endocr Rev 2019;40:17–65.ArticlePubMed
2. Pardoll DM. The blockade of immune checkpoints in cancer immunotherapy. Nat Rev Cancer 2012;12:252–64.ArticlePubMedPMC
3. Haanen JBAG, Carbonnel F, Robert C, Kerr KM, Peters S, Larkin J, et al. Management of toxicities from immunotherapy: ESMO clinical practice guidelines for diagnosis, treatment and follow-up. Ann Oncol 2017;28:iv119–42.ArticlePubMed
4. Abril-Rodriguez G, Ribas A. SnapShot: immune checkpoint inhibitors. Cancer Cell 2017;31:848–8.ArticlePubMed
5. Khoja L, Day D, Wei-Wu Chen T, Siu LL, Hansen AR. Tumour- and class-specific patterns of immune-related adverse events of immune checkpoint inhibitors: a systematic review. Ann Oncol 2017;28:2377–85.ArticlePubMed
6. Khan Z, Hammer C, Guardino E, Chandler GS, Albert ML. Mechanisms of immune-related adverse events associated with immune checkpoint blockade: using germline genetics to develop a personalized approach. Genome Med 2019;11:39.ArticlePubMedPMC
7. Postow MA, Sidlow R, Hellmann MD. Immune-related adverse events associated with immune checkpoint blockade. N Engl J Med 2018;378:158–68.ArticlePubMed
8. Weber JS, Hodi FS, Wolchok JD, Topalian SL, Schadendorf D, Larkin J, et al. Safety profile of nivolumab monotherapy: a pooled analysis of patients with advanced melanoma. J Clin Oncol 2017;35:785–92.ArticlePubMed
9. Barroso-Sousa R, Barry WT, Garrido-Castro AC, Hodi FS, Min L, Krop IE, et al. Incidence of endocrine dysfunction following the use of different immune checkpoint inhibitor regimens: a systematic review and meta-analysis. JAMA Oncol 2018;4:173–82.ArticlePubMed
10. Elia G, Ferrari SM, Galdiero MR, Ragusa F, Paparo SR, Ruffilli I, et al. New insight in endocrine-related adverse events associated to immune checkpoint blockade. Best Pract Res Clin Endocrinol Metab 2020;34:101370.ArticlePubMed
11. Choi J, Lee SY. Clinical characteristics and treatment of immune-related adverse events of immune checkpoint inhibitors. Immune Netw 2020;20:e9.ArticlePubMedPMC
12. Brunn J, Block U, Ruf G, Bos I, Kunze WP, Scriba PC. Volumetric analysis of thyroid lobes by real-time ultrasound (author’s transl). Dtsch Med Wochenschr 1981;106:1338–40.ArticlePubMed
13. Brancatella A, Viola N, Brogioni S, Montanelli L, Sardella C, Vitti P, et al. Graves’ disease induced by immune checkpoint inhibitors: a case report and review of the literature. Eur Thyroid J 2019;8:192–5.ArticlePubMedPMC
14. Yajima K, Akise Y. A case report of graves’ disease induced by the anti-human programmed cell death-1 monoclonal antibody pembrolizumab in a bladder cancer patient. Case Rep Endocrinol 2019 2019:2314032.Article
15. Al Mushref M, Guido PA, Collichio FA, Moore DT, Clemmons DR. Thyroid dysfunction, recovery, and prognosis in melanoma patients treated with immune checkpoint inhibitors: a retrospective review. Endocr Pract 2020;26:36–42.ArticlePubMed
16. Iyer PC, Cabanillas ME, Waguespack SG, Hu MI, Thosani S, Lavis VR, et al. Immune-related thyroiditis with immune checkpoint inhibitors. Thyroid 2018;28:1243–51.ArticlePubMedPMC
17. Basak EA, van der Meer JWM, Hurkmans DP, Schreurs MWJ, Oomen-de Hoop E, van der Veldt AAM, et al. Overt thyroid dysfunction and anti-thyroid antibodies predict response to anti-PD-1 immunotherapy in cancer patients. Thyroid 2020;30:966–73.ArticlePubMed
18. Kotwal A, Kottschade L, Ryder M. PD-L1 inhibitor-induced thyroiditis is associated with better overall survival in cancer patients. Thyroid 2020;30:177–84.ArticlePubMedPMC
19. Peiro I, Palmero R, Iglesias P, Diez JJ, Simo-Servat A, Marin JA, et al. Thyroid dysfunction induced by nivolumab: searching for disease patterns and outcomes. Endocrine 2019;64:605–13.ArticlePubMed
20. Yamauchi I, Yasoda A, Matsumoto S, Sakamori Y, Kim YH, Nomura M, et al. Incidence, features, and prognosis of immune-related adverse events involving the thyroid gland induced by nivolumab. PLoS One 2019;14:e0216954.ArticlePubMedPMC
21. Kurimoto C, Inaba H, Ariyasu H, Iwakura H, Ueda Y, Uraki S, et al. Predictive and sensitive biomarkers for thyroid dysfunctions during treatment with immune-checkpoint inhibitors. Cancer Sci 2020;111:1468–77.ArticlePubMedPMC
22. Darvin P, Toor SM, Sasidharan Nair V, Elkord E. Immune checkpoint inhibitors: recent progress and potential biomarkers. Exp Mol Med 2018;50:1–11.Article
23. de Moel EC, Rozeman EA, Kapiteijn EH, Verdegaal EME, Grummels A, Bakker JA, et al. Autoantibody development under treatment with immune-checkpoint inhibitors. Cancer Immunol Res 2019;7:6–11.ArticlePubMed
24. Mazarico I, Capel I, Gimenez-Palop O, Albert L, Berges I, Luchtenberg F, et al. Low frequency of positive antithyroid antibodies is observed in patients with thyroid dysfunction related to immune check point inhibitors. J Endocrinol Invest 2019;42:1443–50.ArticlePubMed
25. Okada N, Iwama S, Okuji T, Kobayashi T, Yasuda Y, Wada E, et al. Anti-thyroid antibodies and thyroid echo pattern at baseline as risk factors for thyroid dysfunction induced by anti-programmed cell death-1 antibodies: a prospective study. Br J Cancer 2020;122:771–7.ArticlePubMedPMC
26. Kobayashi T, Iwama S, Yasuda Y, Okada N, Tsunekawa T, Onoue T, et al. Patients with antithyroid antibodies are prone to develop destructive thyroiditis by nivolumab: a prospective study. J Endocr Soc 2018;2:241–51.ArticlePubMedPMC
27. Kimbara S, Fujiwara Y, Iwama S, Ohashi K, Kuchiba A, Arima H, et al. Association of antithyroglobulin antibodies with the development of thyroid dysfunction induced by nivolumab. Cancer Sci 2018;109:3583–90.ArticlePubMedPMC
28. Del Rivero J, Cordes LM, Klubo-Gwiezdzinska J, Madan RA, Nieman LK, Gulley JL. Endocrine-related adverse events related to immune checkpoint inhibitors: proposed algorithms for management. Oncologist 2020;25:290–300.ArticlePubMed
29. Stelmachowska-Banas M, Czajka-Oraniec I. Management of endocrine immune-related adverse events of immune checkpoint inhibitors: an updated review. Endocr Connect 2020;9:R207–28.ArticlePubMedPMC
Figure & Data
References
Citations
Citations to this article as recorded by
Thyroid Dysfunction after Atezolizumab and Bevacizumab Is Associated with Favorable Outcomes in Hepatocellular Carcinoma Young Shin Song, Hannah Yang, Beodeul Kang, Jaekyung Cheon, Ilhwan Kim, Hyeyeong Kim, Won Suk Lee, Yun Beom Sang, Sanghoon Jung, Ho Yeong Lim, Vincent E. Gaillard, Chan Kim, Hong Jae Chon Liver Cancer.2024; 13(1): 89. CrossRef
Thyroid dysfunction (TD) induced by PD-1/PD-L1 inhibitors in advanced lung cancer Yanling Wang, Xiaoxuan Yang, Jia Ma, Shenglan Chen, Ping Gong, Ping Dai Heliyon.2024; 10(5): e27077. CrossRef
Non-Invasive Predictive Biomarkers for Immune-Related Adverse Events Due to Immune Checkpoint Inhibitors Ben Ponvilawan, Abdul Wali Khan, Janakiraman Subramanian, Dhruv Bansal Cancers.2024; 16(6): 1225. CrossRef
Implication of the Gut Microbiome and Microbial-Derived Metabolites in Immune-Related Adverse Events: Emergence of Novel Biomarkers for Cancer Immunotherapy David Dora, Syeda Mahak Zahra Bokhari, Kenan Aloss, Peter Takacs, Juliane Zsuzsanna Desnoix, György Szklenárik, Patrick Deniz Hurley, Zoltan Lohinai International Journal of Molecular Sciences.2023; 24(3): 2769. CrossRef
Immune checkpoint inhibitor-associated toxicity in advanced non-small cell lung cancer: An updated understanding of risk factors Xiangxiao Hu, Lina Wang, Bin Shang, Junren Wang, Jian Sun, Bin Liang, Lili Su, Wenjie You, Shujuan Jiang Frontiers in Immunology.2023;[Epub] CrossRef
Immune-related adverse events induced by programmed death protein-1 inhibitors from the perspective of lymphoma immunotherapy Yong-Zhe Hou, Qin Zhang, Hai Bai, Tao Wu, Ya-Jie Chen World Journal of Clinical Cases.2023; 11(7): 1458. CrossRef
Predictive Biomarkers for Checkpoint Inhibitor Immune-Related Adverse Events Iñigo Les, Mireia Martínez, Inés Pérez-Francisco, María Cabero, Lucía Teijeira, Virginia Arrazubi, Nuria Torrego, Ana Campillo-Calatayud, Iñaki Elejalde, Grazyna Kochan, David Escors Cancers.2023; 15(5): 1629. CrossRef
Immune-related thyroid dysfunctions during anti PD-1/PD-L1 inhibitors: new evidence from a single centre experience Alice Nervo, Matteo Ferrari, Giovanni Gruosso, Enrica Migliore, Sara Basile, Valentina D’Angelo, Anna Roux, Alessandro Piovesan, Emanuela Arvat Clinical and Experimental Medicine.2023; 23(8): 4817. CrossRef
RNA Sequencing Reveals Unique Transcriptomic Signatures of the Thyroid in a Murine Lung Cancer Model Treated with PD-1 and PD-L1 Antibodies Rena Pollack, Joshua Stokar, Natan Lishinsky, Irina Gurt, Naomi Kaisar-Iluz, Merav E. Shaul, Zvi G. Fridlender, Rivka Dresner-Pollak International Journal of Molecular Sciences.2023; 24(13): 10526. CrossRef
Immune‐related adverse events after immune check point inhibitors: Understanding the intersection with autoimmunity Namrata Singh, Anne M. Hocking, Jane H. Buckner Immunological Reviews.2023; 318(1): 81. CrossRef
Endocrine Side Effects in Patients Treated with Immune Checkpoint Inhibitors: A Narrative Review Nicia I. Profili, Roberto Castelli, Antonio Gidaro, Alessandro Merella, Roberto Manetti, Giuseppe Palmieri, Margherita Maioli, Alessandro P. Delitala Journal of Clinical Medicine.2023; 12(15): 5161. CrossRef
Incidence of Endocrine-Related Dysfunction in Patients Treated with New Immune Checkpoint Inhibitors: A Meta-Analysis and Comprehensive Review Won Sang Yoo, Eu Jeong Ku, Eun Kyung Lee, Hwa Young Ahn Endocrinology and Metabolism.2023; 38(6): 750. CrossRef
PD-1/PD-L1 Inhibitors in Patients With Preexisting Autoimmune Diseases Ke Zhang, Xiangyi Kong, Yuan Li, Zhongzhao Wang, Lin Zhang, Lixue Xuan Frontiers in Pharmacology.2022;[Epub] CrossRef
Association between the type of thyroid dysfunction induced by immune checkpoint inhibitors and prognosis in cancer patients Han-sang Baek, Chaiho Jeong, Kabsoo Shin, Jaejun Lee, Heysun Suh, Dong-Jun Lim, Moo Il Kang, Jeonghoon Ha BMC Endocrine Disorders.2022;[Epub] CrossRef
A Successful Case of Hepatocellular Carcinoma Treated with Atezolizumab Plus Bevacizumab with Multisystem Immune-related Adverse Events Hidemi Hayashi, Koji Sawada, Takumu Hasebe, Shunsuke Nakajima, Jun Sawada, Yuri Takiyama, Yumi Takiyama, Toshikatsu Okumura, Mikihiro Fujiya Internal Medicine.2022; 61(23): 3497. CrossRef
Immune Related Adverse Events of the Thyroid – A Narrative Review Christopher A. Muir, Venessa H. M. Tsang, Alexander M. Menzies, Roderick J. Clifton-Bligh Frontiers in Endocrinology.2022;[Epub] CrossRef
Thyroid-related adverse events induced by immune checkpoint inhibitors Alexandra Chera, Andreea Lucia Stancu, Octavian Bucur Frontiers in Endocrinology.2022;[Epub] CrossRef
Risk Factors and Biomarkers for Immune-Related Adverse Events: A Practical Guide to Identifying High-Risk Patients and Rechallenging Immune Checkpoint Inhibitors Adithya Chennamadhavuni, Laith Abushahin, Ning Jin, Carolyn J. Presley, Ashish Manne Frontiers in Immunology.2022;[Epub] CrossRef
Case 5: A 41-Year-Old Woman With Palpitation Jiwon Yang, Kabsoo Shin, Jeongmin Lee, Jeonghoon Ha, Dong-Jun Lim, Han-Sang Baek Journal of Korean Medical Science.2022;[Epub] CrossRef
Immune Checkpoint Inhibitors and Endocrine Disorders: A Position Statement from the Korean Endocrine Society Hyemi Kwon, Eun Roh, Chang Ho Ahn, Hee Kyung Kim, Cheol Ryong Ku, Kyong Yeun Jung, Ju Hee Lee, Eun Heui Kim, Sunghwan Suh, Sangmo Hong, Jeonghoon Ha, Jun Sung Moon, Jin Hwa Kim, Mi-kyung Kim Endocrinology and Metabolism.2022; 37(6): 839. CrossRef
Management of Endocrine and Metabolic Toxicities of Immune-Checkpoint Inhibitors: From Clinical Studies to a Real-Life Scenario Calogera Claudia Spagnolo, Giuseppe Giuffrida, Salvatore Cannavò, Tindara Franchina, Nicola Silvestris, Rosaria Maddalena Ruggeri, Mariacarmela Santarpia Cancers.2022; 15(1): 246. CrossRef

 , A Ram Hong


 PubReader
 ePub Link
 Cite
Cite