
Articles
- Page Path
- HOME > Endocrinol Metab > Volume 36(5); 2021 > Article
-
Original ArticleDiabetes, Obesity and Metabolism How Can We Adopt the Glucose Tolerance Test to Facilitate Predicting Pregnancy Outcome in Gestational Diabetes Mellitus?
-
Kyeong Jin Kim1*
 , Nam Hoon Kim1*, Jimi Choi1, Sin Gon Kim1, Kyung Ju Lee2
 -
Endocrinology and Metabolism 2021;36(5):988-996.
DOI: https://doi.org/10.3803/EnM.2021.1107
Published online: October 15, 2021
1Division of Endocrinology and Metabolism, Department of Internal Medicine, Korea University College of Medicine, Seoul, Korea
2Department of Obstetrics and Gynecology, Korea University College of Medicine, Seoul, Korea
- Corresponding author: Kyung Ju Lee. Department of Obstetrics and Gynecology, Korea University Anam Hospital, Korea University College of Medicine, 73 Goryeodae-ro, Seongbuk-gu, Seoul 02841, Korea, Tel: +82-2-920-6844, Fax: +82-2-920-5357, E-mail: drlkj52551@korea.ac.kr
- * These authors contributed equally to this work.
Copyright © 2021 Korean Endocrine Society
This is an Open Access article distributed under the terms of the Creative Commons Attribution Non-Commercial License (https://creativecommons.org/licenses/by-nc/4.0/) which permits unrestricted non-commercial use, distribution, and reproduction in any medium, provided the original work is properly cited.
ABSTRACT
-
Background
- We investigated how 100-g oral glucose tolerance test (OGTT) results can be used to predict adverse pregnancy outcomes in gestational diabetes mellitus (GDM) patients.
-
Methods
- We analyzed 1,059 pregnant women who completed the 100-g OGTT between 24 and 28 weeks of gestation. We compared the risk of adverse pregnancy outcomes according to OGTT patterns by latent profile analysis (LPA), numbers to meet the OGTT criteria, and area under the curve (AUC) of the OGTT graph. Adverse pregnancy outcomes were defined as a composite of preterm birth, macrosomia, large for gestational age, low APGAR score at 1 minute, and pregnancy-induced hypertension.
-
Results
- Overall, 257 participants were diagnosed with GDM, with a median age of 34 years. An LPA led to three different clusters of OGTT patterns; however, there were no significant associations between the clusters and adverse pregnancy outcomes after adjusting for confounders. Notwithstanding, the risk of adverse pregnancy outcome increased with an increase in number to meet the OGTT criteria (P for trend=0.011); odds ratios in a full adjustment model were 1.27 (95% confidence interval [CI], 0.72 to 2.23), 2.16 (95% CI, 1.21 to 3.85), and 2.32 (95% CI, 0.66 to 8.15) in those meeting the 2, 3, and 4 criteria, respectively. The AUCs of the OGTT curves also distinguished the patients at risk of adverse pregnancy outcomes; the larger the AUC, the higher the risk (P for trend=0.007).
-
Conclusion
- The total number of abnormal values and calculated AUCs for the 100-g OGTT may facilitate tailored management of patients with GDM by predicting adverse pregnancy outcomes.
- Gestational diabetes mellitus (GDM) is defined as glucose intolerance first recognized during pregnancy, regardless of whether the condition started before pregnancy. The incidence of GDM has increased worldwide, and its clinical implications have been highlighted in the context of the rapid increase in the prevalence of early onset type 2 diabetes, especially for child-bearing women [1–4]. For decades, large clinical studies have focused on establishing diagnostic criteria that distinguish between GDM and healthy pregnancies [5–7]. The International Association of Diabetes and Pregnancy Study Group [8] adopted the results of the Hyperglycemia and Adverse Pregnancy Outcome study [6] to diagnose GDM using a one-step 75-g oral glucose tolerance test (OGTT). This new criterion has been widely accepted by multiple guidelines; however, many of them, including the National Institutes of Health [9] and American College of Obstetricians and Gynecologists [10] still support the two-step approach.
- The current guidelines for diabetes management recommend that all pregnant women not previously diagnosed with diabetes should be screened for GDM at 24 to 28 weeks of gestation [1,11]. GDM is closely associated with an increased risk of maternal complications, including preeclampsia, as well as perinatal fetal morbidities, such as macrosomia, large for gestational age (LGA), and preterm birth. It is also associated with a high risk of developing future type 2 diabetes and even mortality in affected women [12,13].
- The serious health outcomes related to GDM inevitably raise the question of how to predict and manage adverse outcomes. We considered whether the outcome could be predicted using the results of the 100-g OGTT in affected individuals at the time GDM was diagnosed. Several previous studies have shown controversial results, probably due to the small number of study participants, different definitions of adverse pregnancy outcomes, or even ethnic differences, leaving this issue to be elucidated [13–15].
- In view of this, we investigated how a 100-g OGTT result, obtained simultaneously with a GDM diagnosis, can be used to predict adverse pregnancy outcomes in a large survey of Korean pregnant women.
INTRODUCTION
- Study design and subjects
- This retrospective cohort study included 2,789 pregnant women who delivered at Gangnam CHA Medical Center (Seoul, Korea) between July 1, 2007, and December 31, 2009. Those with twin pregnancy, fetal anomaly, hypertensive disorder before pregnancy, diabetes, and missing pre-pregnancy or delivery weights were excluded. Among these participants, we analyzed 1,058 pregnant women who completed the 100-g OGTT after a 50-g glucose challenge test between 24 and 28 weeks of gestation. Routine prenatal examinations, including maternal body weight, blood pressure, and fetal crown-rump length, were performed at 11, 16, 26, and 35 gestational weeks at obstetrics outpatient clinics. Blood tests, including hemoglobin, fasting glucose, lipid profile, C-peptide, and insulin, were conducted at 26 gestational weeks. Based on the Korean Diabetes Association guidelines [16], target glucose levels were as follows: fasting glucose <95 mg/dL, 1-hour postprandial glucose <140 mg/dL, and 2-hour postprandial glucose <120 mg/dL. Of the 257 patients with GDM, 18 received insulin treatment to achieve the target blood glucose level. This study was approved by the Institutional Review Board of Gangnam CHA Medical Center (IRB No. KNC 10-025). Informed consent was waived because all the patient data were anonymized and de-identified. The detailed protocol has been previously published [17,18].
- A 100-g OGTT was conducted in pregnant women who met the diagnostic criteria of 50-g oral glucose challenge tests, which is a 1-hour glucose level ≥130 mg/dL, between 24 and 28 weeks of gestation. We defined GDM as two or more of the following positive results in a 3-hour 100-g OGTT after an overnight fast of at least 8 hours, but no more than 14 hours: fasting, ≥95 mg/dL; 1-hour, ≥180 mg/dL; 2-hour, ≥155 mg/dL; and 3-hour, ≥140 mg/dL [5].
- Definition of adverse pregnancy outcomes
- Adverse pregnancy outcomes were defined as the following combined neonatal and maternal adverse outcomes: (1) preterm birth, defined as delivery before 37 weeks of gestation; (2) macrosomia, defined as birth weight >4,000 g regardless of gestational age of the fetus; (3) LGA birth, defined as birth weight >90th percentile; (4) low “appearance, pulse, grimace, activity, and respiration” (APGAR) score, defined as a 1-minute APGAR score <5; and (5) pregnancy-induced hypertension, defined as systolic blood pressure (SBP) >140 mm Hg or diastolic blood pressure >90 mm Hg after 20 gestational weeks.
- Statistical analyses
- Continuous data are presented as mean±standard deviation for normally distributed variables and as medians and interquartile ranges (IQRs) for non-normally distributed variables. Categorical data are presented as frequencies and percentages. Student’s t test, Mann-Whitney U test, chi-square test, and Fisher’s exact test were used to compare baseline characteristics between the normal and GDM groups. Latent profile analysis (LPA) was performed to identify glucose patterns in patients with GDM based on four measurements during the OGTT. This method assumes that unobserved latent profiles generate patterns of responses in a series of continuous variables. The optimal number of clusters was determined by considering the Bayesian information criterion (BIC) value, distribution of cluster membership probabilities, cluster sizes, and interpretability of the identified patterns [19,20]. A three-cluster model was selected because it had a lower BIC value than the other models, and all cluster sizes were >10% of the number of patients with GDM (Supplemental Table S1). To classify individuals exclusively into three glucose patterns, we assigned patients to the cluster with the highest cluster membership probability. The individual area under the curve (AUC) for the OGTT was adopted to evaluate the severity of maternal hyperglycemia by summing the area of three trapezoids as follows: (0-hour+1-hour glucose)/2, (1- hour+2-hour glucose)/2, and (2-hour+3-hour glucose)/2. Binary logistic regression analysis was performed to compare the prevalence of outcomes between the normal and three latent glucose pattern groups, four groups by classifying quartiles of individual AUCs, or three groups according to the number of criteria in GDM patients. Two multiple logistic regression models were used to control for the confounding factors. Model A included age, preexisting hypertension, family history of diabetes mellitus, family history of hypertension, pre-pregnancy body mass index (BMI), parity, and gestational age before delivery as covariates. Model B additionally included SBP, glucose level at 35 weeks, and insulin treatment. The risk associated with the outcome was calculated and presented as the odds ratio (OR) and corresponding 95% confidence interval (CI). We also used a restricted cubic spline (RCS) curve with four knots for the adjusted ORs to graphically demonstrate the nonlinear relationship between the individual AUC for OGTT and the risk of adverse pregnancy outcomes. All reported P values were two-sided, and statistical significance was set at P<0.05. We used the Mclust function in the mclust package (version 5.4.6) in R software version 4.0.3 (R Foundation for Statistical Computing, Vienna, Austria) to conduct the LPA [21]. All other statistical analyses were performed using SAS software version 9.4 (SAS Institute Inc., Cary, NC, USA).
METHODS
- Baseline characteristics of the study population
- The present study included 1,058 women, with a median age of 33 years (IQR, 30 to 35) who completed the 100-g OGTT between 24 and 28 weeks of gestation. Among them, 257 women, with a median age of 34 years (IQR, 31 to 36) were diagnosed with GDM. Table 1 presents the baseline characteristics of the study participants. Family history of diabetes mellitus (25.7% vs. 17.7%) and past history of GDM (5.5% vs. 0.6%) was more prevalent in the GDM group than in the normal group. The pre-gestational BMI was 21.6 kg/m2 (IQR, 19.7 to 24.0) in the GDM group and 20.3 kg/m2 (IQR, 18.9 to 22.3) in the normal group. Glycosylated hemoglobin at 26 gestational weeks was 34 mmol/mol (5.3%) (IQR, 32 to 37 [5.1% to 5.5%]) and 33 mmol/mol (5.2%) (IQR, 31 to 37 mmol/mol [5.0% to 5.5%]) in the GDM and normal groups, respectively (P=0.002). The median levels of glucose during the 100-g OGTT in the GDM group were 84 mg/dL (IQR, 78 to 91), 185 mg/dL (IQR, 168 to 198), 173 mg/dL (IQR, 161 to 188), and 150 mg/dL (IQR, 141 to 164) at baseline, 1, 2, and 3 hours, respectively. Systolic (116.3 mm Hg vs. 112.8 mm Hg) and diastolic blood pressure (69.3 mm Hg vs. 66.8 mm Hg) at 26 weeks of gestation were significantly higher in the GDM group than in the normal group. Homeostatic model assessment of insulin resistance was significantly higher in the GDM group than in the normal group (1.31 vs. 0.94, P<0.001). However, total cholesterol, triglyceride, and high-density lipoprotein cholesterol levels measured at 26 gestational weeks were comparable between the groups.
- Adverse pregnancy outcomes according to OGTT patterns classified by LPA
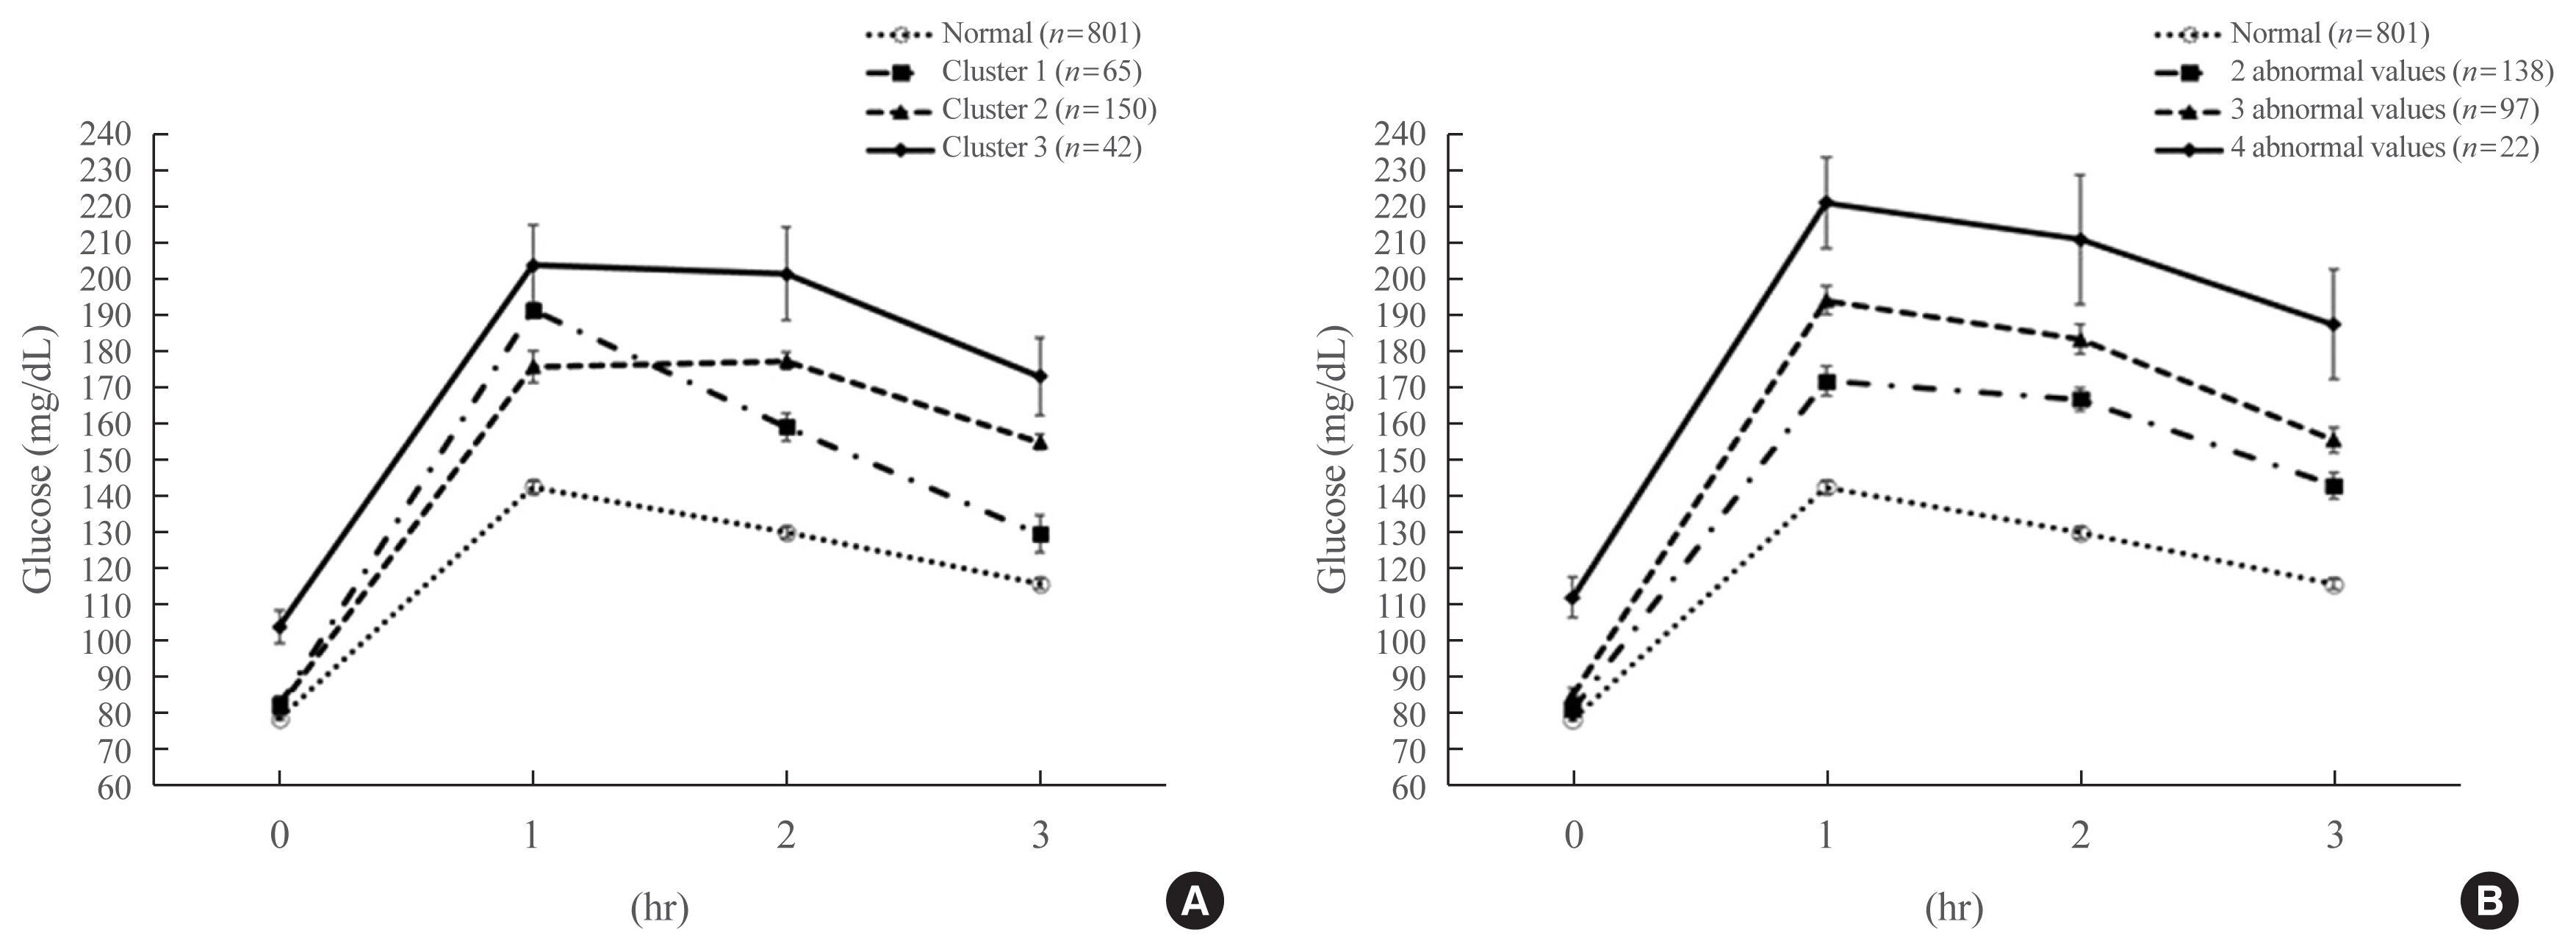
- Adverse outcomes of composite pregnancy occurred more frequently in the GDM group than in the normal healthy group (28.4%, 73/257 vs. 15.5%, 124/801; P<0.001) (Supplemental Table S2). Initially, we conducted an LPA analysis to identify OGTT patterns in patients with GDM based on four glucose measurements (Fig. 1A, Supplemental Table S3). We identified the following three distinct patterns: Cluster 1 (early incremental pattern with a peak at 1 hour and low values at 2 and 3 hours), Cluster 2 (late incremental pattern with a low value at 1 hour and a peak at 2 hours), and Cluster 3 (high fasting glucose combined with high levels at all points). In an unadjusted model, the risks of adverse pregnancy outcomes were higher in clusters 2 and 3 than in the normal group (Table 2). However, after adjusting for age, preexisting hypertension, family history of diabetes mellitus and hypertension, BMI, parity, SBP, glucose levels at 35 weeks of gestation, and insulin treatment, the associations of LPA clusters with pregnancy outcomes were no longer significant.
- Adverse pregnancy outcomes according to OGTT pattern classified by number of abnormal values and AUC
- Further categorization of the GDM patients into three groups (Fig. 1B, Supplemental Table S4), the number of abnormal glucose values meeting the 100-g OGTT criteria revealed adverse outcomes in 29 out of 138 patients (21.0%) with abnormal values at two time points, 31 out of 97 (32.0%) with abnormal values at three time points, and 13 out of 22 (59.1%) with abnormal values at four time points (Table 3). As a reference to subjects with normal OGTT results, the ORs for adverse pregnancy outcomes were 1.45 (95% CI, 0.92 to 2.28) for those with two abnormal results, 2.56 (95% CI, 1.61 to 4.09) for those with three abnormal results, and 7.89 (95% CI, 3.30 to 18.85) for those with four abnormal results. After full adjustment for confounding factors, the ORs were 1.27 (95% CI, 0.72 to 2.23), 2.16 (95% CI, 1.21 to 3.85), and 2.32 (95% CI, 0.66 to 8.15), respectively.
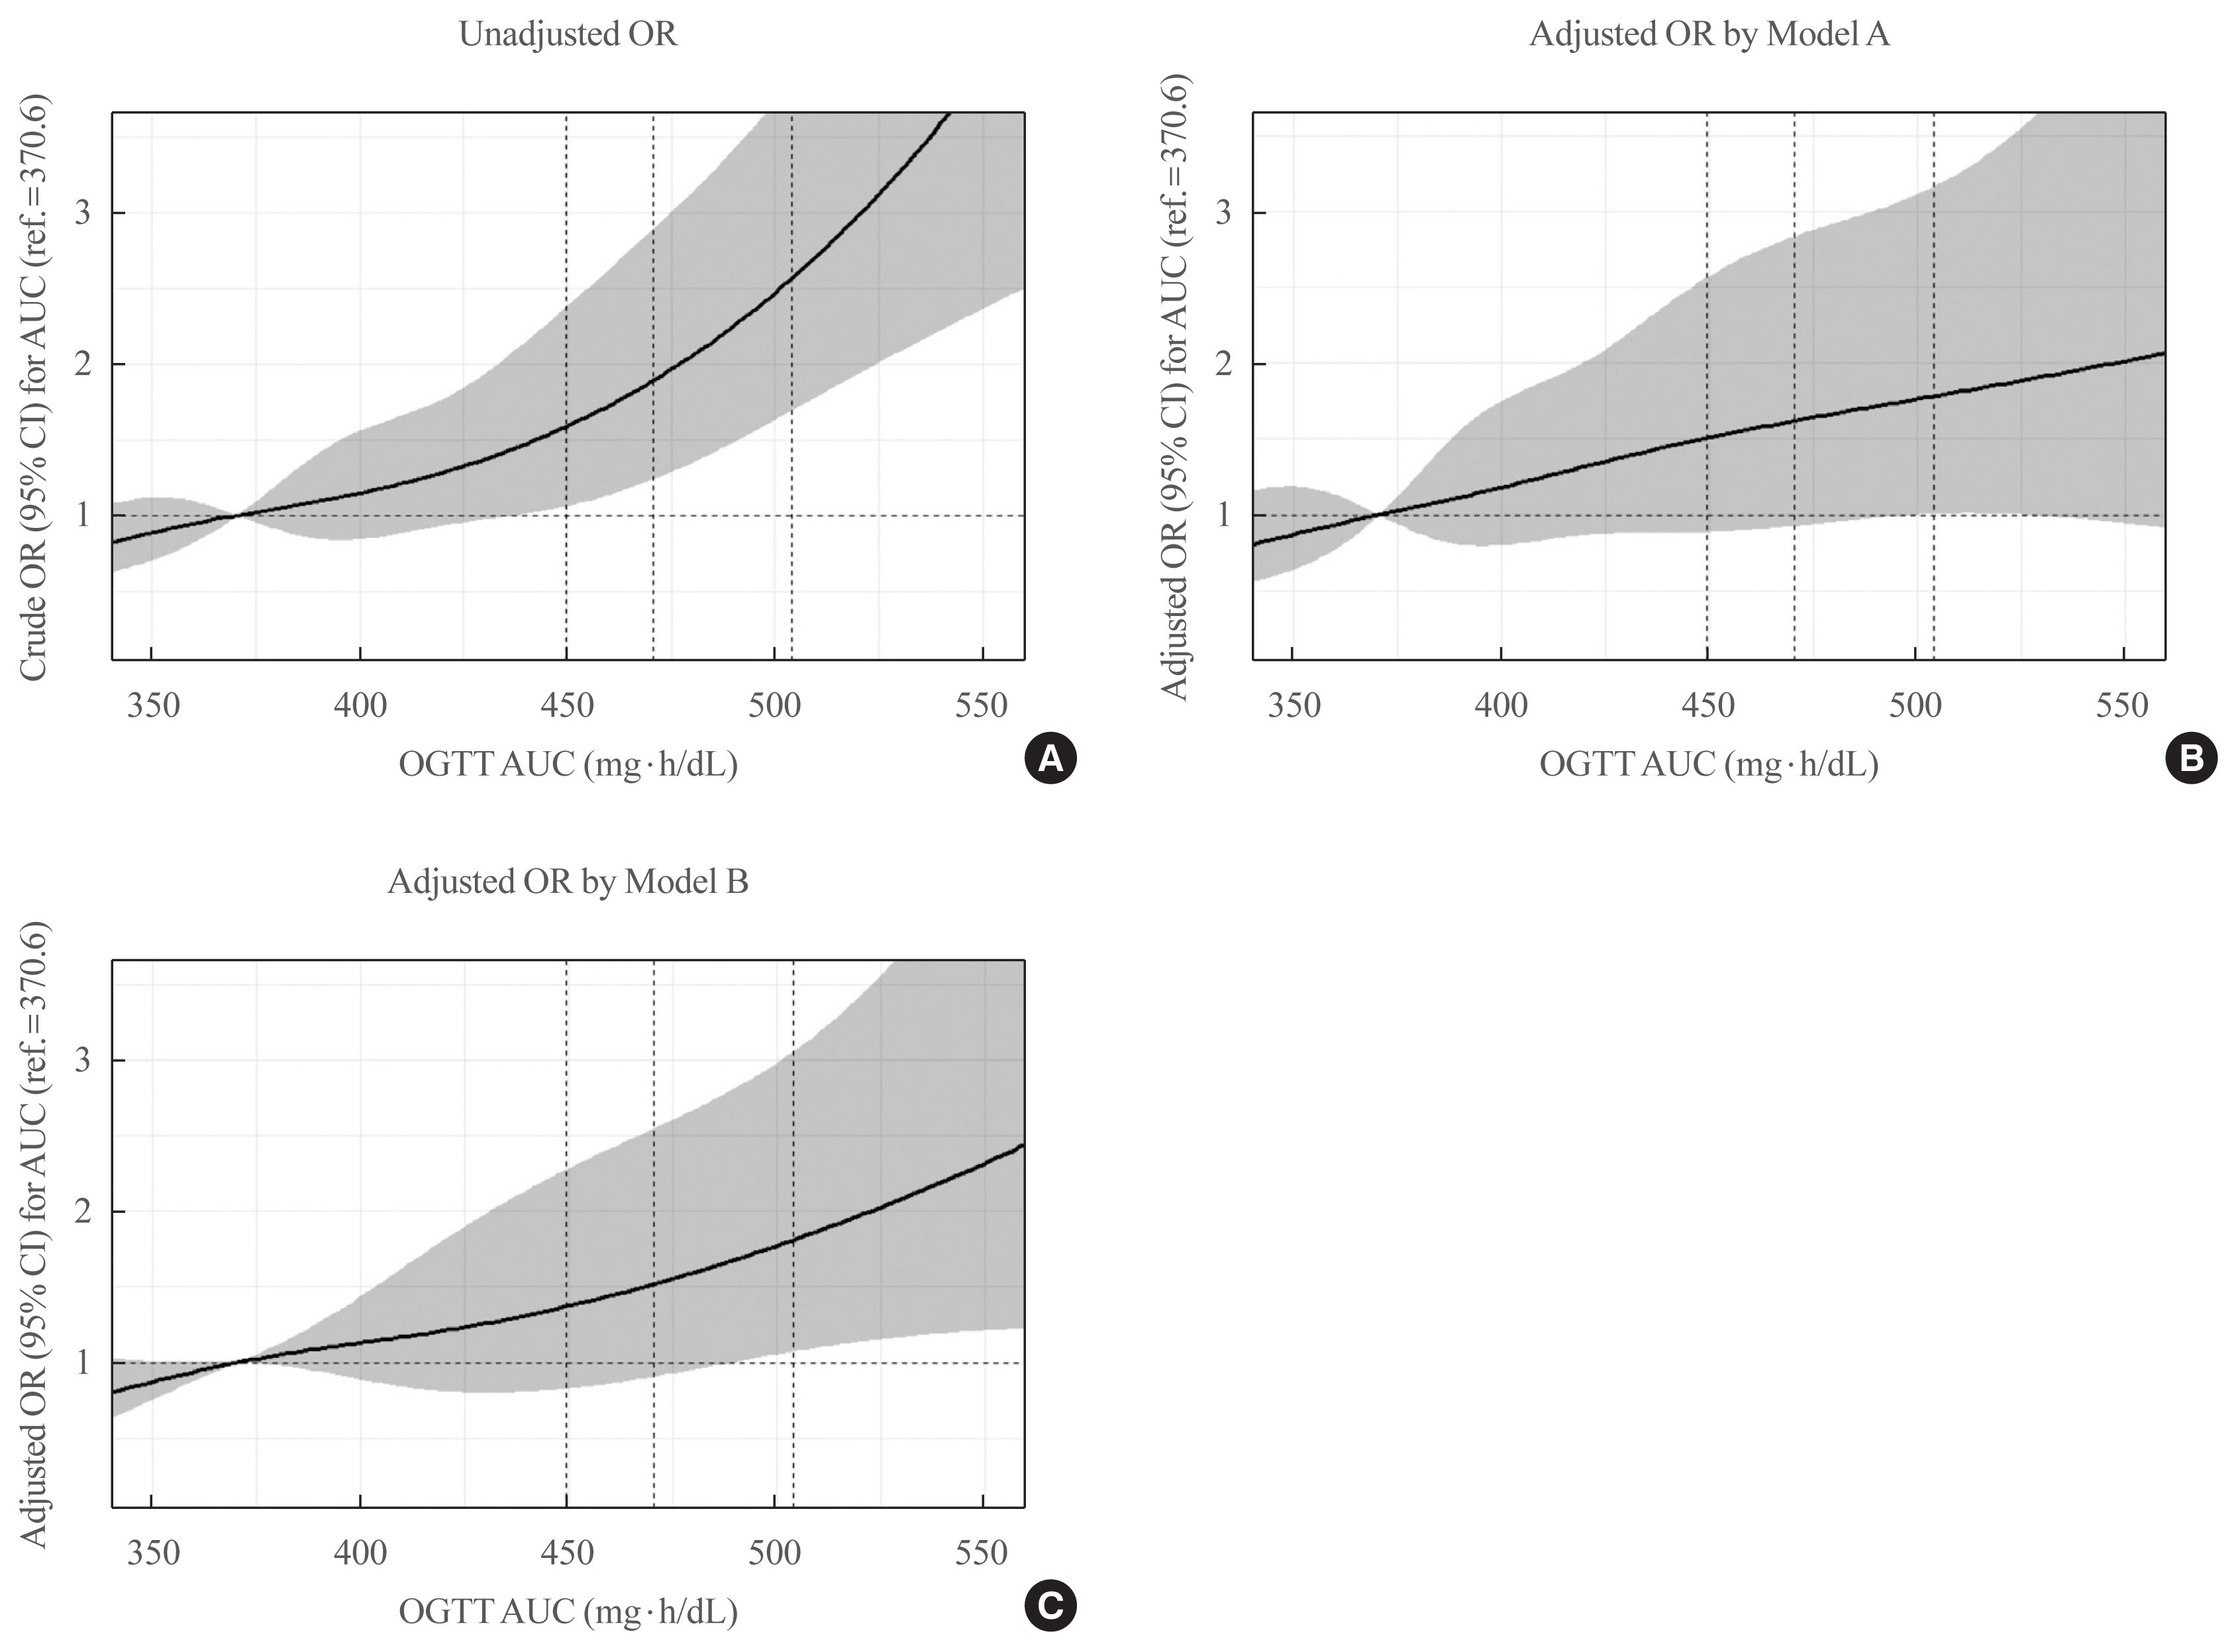
- We also calculated the AUC for the OGTT and analyzed the association between the AUC and adverse outcomes using a multivariate regression model with RCS (Fig. 2). RCS analysis demonstrated a nearly linear association between the AUC and the risk of adverse outcomes. The log unadjusted OR continuously increased as AUC increased. After adjusting for confounders (model A and model B), linear associations between AUC and log OR still existed, albeit with a wider CI. Table 4 shows that the highest quartile group had a significantly higher OR (OR, 2.31; 95% CI, 1.09 to 4.91) in the full adjustment model for adverse outcomes than the normal group did.
RESULTS
- This study has demonstrated that a higher number of patients meeting the diagnostic criteria of the 100-g OGTT or a higher AUC of the OGTT curve is significantly associated with increased adverse pregnancy outcomes in GDM than those in normal glucose tolerant subjects, suggesting that a more thorough interpretation of OGTT results should be made at the time of GDM diagnosis.
- Over the past decades, the prevalence of obesity and diabetes mellitus has increased robustly, and both have become serious health problems worldwide [3]. According to the International Diabetes Federation, one in six live births, approximately 20 million, is affected by hyperglycemia during pregnancy, with 84% of mothers having gestational diabetes [22]. Compared to general diabetes, GDM has more significant clinical implications in that it can influence both neonates and mothers. Although numerous studies have been conducted on diagnostic criteria, treatment targets, and prognostic factors, many of these findings remain controversial.
- Several previous reports have investigated the association between the AUC of the OGTT and pregnancy outcomes. Kim et al. [23] reported that the AUC for the 100-g OGTT was associated with an increased risk of LGA in GDM. Another study from China demonstrated that a higher AUC for the 75-g OGTT was related to adverse pregnancy outcomes, such as hypertensive disease and macrosomia [24]. Our study findings are consistent with these results, demonstrating that hyperglycemia itself is an important pitfall for adverse perinatal outcomes though a more meticulous analysis of the OGTT results. It is also necessary to explain why primary cesarean section (CS) was not included as an adverse pregnancy outcome in our study. Despite the efforts of the Korean government to reduce the CS rate, our study shows that most of the GDM patients (85.2% [219/257]) had undergone primary CS. GDM patients preferred CS since health service accessibility in Korea was high and GDM patients wanted to avoid complications during the vaginal delivery [25–27].
- We clustered all subjects based on the LPA, presenting specific patterns such as impaired fasting glucose-like pattern, impaired glucose tolerance-like pattern, and combined patterns (Fig. 1A), since we initially expected the OGTT patterns reflecting the individual insulin response to play an important role in adverse pregnancy outcomes. However, we did not find significant associations between OGTT patterns and pregnancy outcomes. We postulate that hyperglycemia itself is a matter of substance because the number of abnormal values and AUCs during the 100-g OGTTs were independent risk factors for adverse pregnancy outcomes. Moreover, the ORs for three and four abnormal values in Table 3 slightly decreased after additional adjustment for treatment-related factors in Model 2, underpinning the importance of hyperglycemic control and related risk factor management. The OR for the four abnormal values in Table 3 was not significant after full adjustment for the confounding factors. This loss of statistical significance, albeit the highest adverse event rate, might be deduced by the absolute small number of patients and event numbers in this group. In the regression analysis, to present ORs for the adverse outcomes in each classification, most of the major confounding variables addressed at baseline were adjusted in Model 2 to reduce selection bias.
- This study had some limitations that require comments. The first is the fundamental limitation of the single-center retrospective study design. Nevertheless, this single-center design involved a uniform prenatal screening protocol and patient management, as well as standardized data collection for adverse pregnancy outcomes. Second, primary CS was not included among adverse pregnancy outcomes since it is not the result of an adverse pregnancy outcome but rather a preference in Korea, where the CS rate is high. Third, the lack of information on insulin levels constrained the investigation of the association between insulin response and OGTT patterns. Finally, the lack of information on short-term follow-up OGTT results of GDM patients and long-term adverse events, such as future maternal diabetes mellitus or early childhood obesity, hindered us from completely examining the natural course of overall adverse pregnancy outcomes. Therefore, larger and longer-term clinical studies are warranted to arrive at definite conclusions.
- In summary, this study elucidated that risk stratification for adverse pregnancy outcomes in GDM patients is conceivable at the time of GDM diagnosis, suggesting that aggressive risk management and tailored treatment are warranted in GDM patients with higher numbers to meet the diagnostic criteria of the 100-g OGTT or higher AUC values for OGTT curves. Our results also suggest that the AUC value is an independent predictor of adverse pregnancy outcomes, requiring further long-term, large-sample studies.
DISCUSSION
-
Acknowledgements
- The authors thank the participants in the study cohort and the staffs at Gangnam CHA Hospital, Seoul, Korea, for critical comments.
SUPPLEMENTARY INFORMATION
Supplemental Table S1.
Supplemental Table S2.
Supplemental Table S3.
Supplemental Table S4.
-
CONFLICTS OF INTEREST
No potential conflict of interest relevant to this article was reported.
-
AUTHOR CONTRIBUTIONS
Conception or design: N.H.K., S.G.K. Acquisition, analysis, or interpretation of data: K.J.K., N.H.K., J.C., S.G.K., K.J.L. Drafting the work or revising: K.J.K., N.H.K. Final approval of the manuscript: K.J.L.
Article information
Values are expressed as median (interquartile range), number (%), or mean±standard deviation.
GDM, gestational diabetes mellitus; BMI, body mass index; HTN, hypertension; DM, diabetes mellitus; OGTT, oral glucose tolerance test; HbA1c, glycosylated hemoglobin; HOMA-IR, homeostatic model assessment of insulin resistance; HOMA-β, homeostatic model assessment of β cell; SBP, systolic blood pressure; DBP, diastolic blood pressure; FBG, fasting blood glucose; TC, total cholesterol; TG, triglyceride; HDL-C, high-density lipoprotein cholesterol.
| No. of events, no./total (%) | Unadjusted model | P value | Model 1a | P value | Model 2b | P value | |
|---|---|---|---|---|---|---|---|
| Normal | 124/801 (15.5) | 1 (Reference) | 1 (Reference) | 1 (Reference) | |||
|
|
|||||||
| GDM | |||||||
| Cluster 1 | 16/65 (24.6) | 1.78 (0.98–3.24) | 0.057 | 1.58 (0.80–3.10) | 0.189 | 1.57 (0.72–3.45) | 0.260 |
| Cluster 2 | 38/150 (25.3) | 1.85 (1.22–2.81) | 0.004 | 1.54 (0.97–2.45) | 0.071 | 1.59 (0.93–2.74) | 0.091 |
| Cluster 3 | 19/42 (45.2) | 4.51 (2.39–8.53) | <0.001 | 2.97 (1.45–6.09) | 0.003 | 2.10 (0.87–5.08) | 0.100 |
|
|
|||||||
| P for trend test | <0.001 | 0.002 | 0.002 | ||||
GDM, gestational diabetes mellitus.
a Adjusted for age, preexisting hypertension, family history of diabetes mellitus, family history of hypertension, pre-pregnancy body mass index (BMI), parity (yes or no), and gestational age (before delivery);
b Adjusted for age, preexisting hypertension, family history of diabetes mellitus, family history of hypertension, pre-pregnancy BMI, parity (yes or no), gestational age (before delivery), systolic blood pressure at 35 weeks of gestation, diastolic blood pressure at 35 weeks of gestation, fasting blood glucose at 35 weeks of gestation, and insulin treatment.
| No. of events, no./total (%) | Unadjusted Model | P value | Model 1a | P value | Model 2b | P value | |
|---|---|---|---|---|---|---|---|
| Normal | 124/801 (15.5) | 1 (Reference) | 1 (Reference) | 1 (Reference) | |||
|
|
|||||||
| No. of abnormal values | |||||||
| 2 | 29/138 (21.0) | 1.45 (0.92–2.28) | 0.106 | 1.25 (0.76–2.06) | 0.385 | 1.27 (0.72–2.23) | 0.414 |
| 3 | 31/97 (32.0) | 2.56 (1.61–4.09) | <0.001 | 2.20 (1.30–3.74) | 0.003 | 2.16 (1.21–3.85) | 0.009 |
| 4 | 13/22 (59.1) | 7.89 (3.30–18.85) | <0.001 | 4.03 (1.51–10.79) | 0.006 | 2.32 (0.66–8.15) | 0.188 |
|
|
|||||||
| P for trend test | <0.001 | <0.001 | 0.011 | ||||
OGTT, oral glucose tolerance test.
a Adjusted for age, preexisting hypertension, family history of diabetes mellitus, family history of hypertension, pre-pregnancy body mass index (BMI), parity (yes or no), and gestational age (before delivery);
b Adjusted for age, preexisting hypertension, family history of diabetes mellitus, family history of hypertension, pre-pregnancy BMI, parity (yes or no), gestational age (before delivery), systolic blood pressure at 35 weeks of gestation, diastolic blood pressure at 35 weeks of gestation, fasting blood glucose at 35 weeks of gestation, and insulin treatment.
| No. of events, no./total (%) | Unadjusted model | P value | Model 1a | P value | Model 2b | P value | |
|---|---|---|---|---|---|---|---|
| Normal | 124/801 (15.5) | 1 (Reference) | 1 (Reference) | 1 (Reference) | |||
|
|
|||||||
| AUC quartile (min–max) | |||||||
| Q1 (364.5–449.0) | 12/64 (18.8) | 1.26 (0.65–2.43) | 0.490 | 1.14 (0.56–2.34) | 0.720 | 1.00 (0.43–2.29) | 0.995 |
| Q2 (449.5–470.0) | 12/65 (18.5) | 1.24 (0.64–2.38) | 0.526 | 1.02 (0.49–2.11) | 0.954 | 1.63 (0.73–3.66) | 0.233 |
| Q3 (470.5–503.5) | 21/65 (32.3) | 2.61 (1.50–4.53) | 0.001 | 2.34 (1.25–4.37) | 0.008 | 2.03 (0.98–4.21) | 0.057 |
| Q4 (504.0–727.0) | 28/63 (44.4) | 4.37 (2.56–7.44) | <0.001 | 2.84 (1.55–5.18) | 0.001 | 2.31 (1.09–4.91) | 0.030 |
|
|
|||||||
| P for trend test | <0.001 | <0.001 | 0.007 | ||||
AUC, area under the curve; OGTT, oral glucose tolerance test.
a Adjusted for age, preexisting hypertension, family history of diabetes mellitus, family history of hypertension, pre-pregnancy body mass index (BMI), parity (yes or no), and gestational age (before delivery);
b Adjusted for age, preexisting hypertension, family history of diabetes mellitus, family history of hypertension, pre-pregnancy BMI, parity (yes or no), gestational age (before delivery), systolic blood pressure at 35 weeks of gestation, diastolic blood pressure at 35 weeks of gestation, fasting blood glucose at 35 weeks of gestation, and insulin treatment.
- 1. American Diabetes Association. 6. Glycemic targets: standards of medical care in diabetes-2020. Diabetes Care 2020;43(Suppl 1):S66–76.ArticlePubMedPDF
- 2. Magliano DJ, Islam RM, Barr ELM, Gregg EW, Pavkov ME, Harding JL, et al. Trends in incidence of total or type 2 diabetes: systematic review. BMJ 2019;366:l5003.ArticlePubMedPMC
- 3. World Health Organization. Diabetes [Internet] Geneva: WHO; 2021 [cited 2021 Sep 16]. Available from: https://www.who.int/news-room/fact-sheets/detail/diabetes .
- 4. Kim BY, Won JC, Lee JH, Kim HS, Park JH, Ha KH, et al. Diabetes fact sheets in Korea, 2018: an appraisal of current status. Diabetes Metab J 2019;43:487–94.ArticlePubMedPMC
- 5. Carpenter MW, Coustan DR. Criteria for screening tests for gestational diabetes. Am J Obstet Gynecol 1982;144:768–73.ArticlePubMed
- 6. HAPO Study Cooperative Research Group. Metzger BE, Lowe LP, Dyer AR, Trimble ER, Chaovarindr U, et al. Hyperglycemia and adverse pregnancy outcomes. N Engl J Med 2008;358:1991–2002.ArticlePubMed
- 7. Classification and diagnosis of diabetes mellitus and other categories of glucose intolerance. National Diabetes Data Group. Diabetes 1979;28:1039–57.ArticlePubMedPDF
- 8. International Association of Diabetes and Pregnancy Study Groups Consensus Panel. Metzger BE, Gabbe SG, Persson B, Buchanan TA, Catalano PA, et al. International association of diabetes and pregnancy study groups recommendations on the diagnosis and classification of hyperglycemia in pregnancy. Diabetes Care 2010;33:676–82.ArticlePubMedPMC
- 9. Vandorsten JP, Dodson WC, Espeland MA, Grobman WA, Guise JM, Mercer BM, et al. NIH consensus development conference: diagnosing gestational diabetes mellitus. NIH Consens State Sci Statements 2013;29:1–31.PubMed
- 10. Caughey AB. Gestational diabetes mellitus. Obstet Gynecol 2017;130:E17–31.PubMed
- 11. Kim MK, Ko SH, Kim BY, Kang ES, Noh J, Kim SK, et al. 2019 Clinical practice guidelines for type 2 diabetes mellitus in Korea. Diabetes Metab J 2019;43:398–406.ArticlePubMedPMC
- 12. McIntyre HD, Catalano P, Zhang C, Desoye G, Mathiesen ER, Damm P. Gestational diabetes mellitus. Nat Rev Dis Primers 2019;5:47.ArticlePubMed
- 13. Buchanan TA, Xiang AH, Page KA. Gestational diabetes mellitus: risks and management during and after pregnancy. Nat Rev Endocrinol 2012;8:639–49.ArticlePubMedPMC
- 14. Gruendhammer M, Brezinka C, Lechleitner M. The number of abnormal plasma glucose values in the oral glucose tolerance test and the feto-maternal outcome of pregnancy. Eur J Obstet Gynecol Reprod Biol 2003;108:131–6.ArticlePubMed
- 15. Kim HS, Chang KH, Yang JI, Yang SC, Lee HJ, Ryu HS. Clinical outcomes of pregnancy with one elevated glucose tolerance test value. Int J Gynaecol Obstet 2002;78:131–8.ArticlePubMed
- 16. Korean Diabetes Association. 2021 Clinical practice guideline for diabetes 7th ed. Seoul: KDA; 2021 Available from: https://www.diabetes.or.kr/pro/publish/guide.php?code=guide&number=853&mode=view .
- 17. Hur J, Cho EH, Baek KH, Lee KJ. Prediction of gestational diabetes mellitus by unconjugated estriol levels in maternal serum. Int J Med Sci 2017;14:123–7.ArticlePubMedPMC
- 18. Cho EH, Hur J, Lee KJ. Early gestational weight gain rate and adverse pregnancy outcomes in Korean women. PLoS One 2015;10:e0140376.ArticlePubMedPMC
- 19. Van De Schoot R, Sijbrandij M, Winter SD, Depaoli S, Vermunt JK. The GRoLTS-checklist: guidelines for reporting on latent trajectory studies. Struct Equ Modeling 2017;24:451–67.Article
- 20. Hulman A, Vistisen D, Glumer C, Bergman M, Witte DR, Faerch K. Glucose patterns during an oral glucose tolerance test and associations with future diabetes, cardiovascular disease and all-cause mortality rate. Diabetologia 2018;61:101–7.ArticlePubMed
- 21. Scrucca L, Fop M, Murphy TB, Raftery AE. Mclust 5: clustering, classification and density estimation using gaussian finite mixture models. R J 2016;8:289–317.ArticlePubMedPMC
- 22. International Diabetes Federation. IDF diabetes atlas 9th ed.Brussels: IDF; 2020 Available from: https://diabetesatlas.org/en .
- 23. Kim S, Min WK, Chun S, Lee W, Chung HJ, Lee PR, et al. Quantitative risk estimation for large for gestational age using the area under the 100-g oral glucose tolerance test curve. J Clin Lab Anal 2009;23:231–6.ArticlePubMedPMC
- 24. Zhang C, Wei Y, Sun W, Yang H. The area under the curve (AUC) of oral glucose tolerance test (OGTT) could be a measure method of hyperglycemia in all pregnant women. Open J Obstet Gynecol 2019;9:186–95.Article
- 25. Kim AM, Park JH, Kang S, Yoon TH, Kim Y. An ecological study of geographic variation and factors associated with cesarean section rates in South Korea. BMC Pregnancy Childbirth 2019;19:162.ArticlePubMedPMC
- 26. Betran AP, Ye J, Moller AB, Zhang J, Gulmezoglu AM, Torloni MR. The increasing trend in caesarean section rates: global, regional and national estimates: 1990–2014. PLoS One 2016;11:e0148343.ArticlePubMedPMC
- 27. Chung SH, Seol HJ, Choi YS, Oh SY, Kim A, Bae CW. Changes in the cesarean section rate in Korea (1982–2012) and a review of the associated factors. J Korean Med Sci 2014;29:1341–52.ArticlePubMedPMC
References
Figure & Data
References
Citations
- Risk factors combine in a complex manner in assessment for macrosomia
Yi-Wen Wang, Yan Chen, Yong-Jun Zhang
BMC Public Health.2023;[Epub] CrossRef - Association of the Severity of Hypertensive Disorders in Pregnancy with Birthweight, Childhood Obesity, and Blood Pressure at Age 7
Yan Chen, Yiwen Wang, Yanjun Li, Guodong Ding, Yongjun Zhang
Nutrients.2023; 15(14): 3104. CrossRef
 PubReader
 ePub Link
 Cite
Cite


